3. Performance Scores
The various scores for the major test areas are displayed here. Following is a description of each score provided.
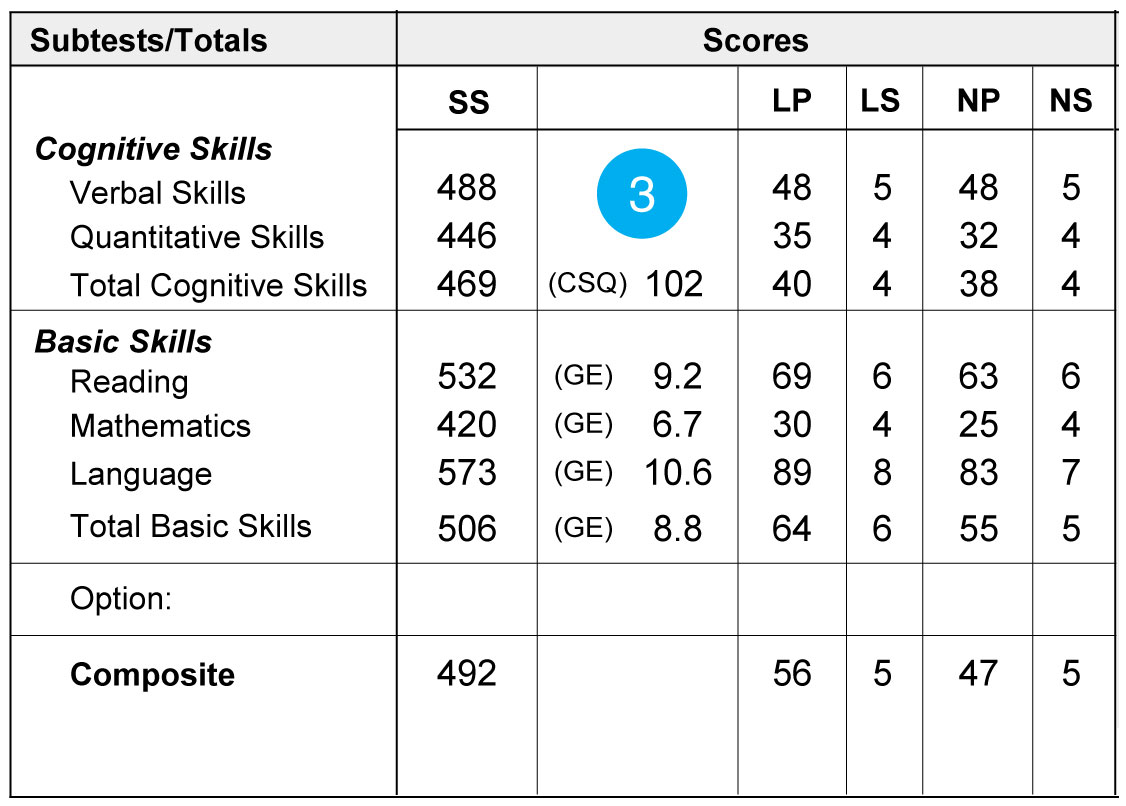
Standard Score (SS)
Raw scores (the number of correct answers) are converted to standard scores. Standard scores range from 200-800 with a score of 500
being exactly average. Standard scores are provided for all major test areas except the optional test. A raw score (RS) is provided instead for the optional test.
Grade Equivalent (GE)
While National Percentile ranks compare your performance with students at the same grade level, Grade Equivalents compare your performance with the average performance of students at other grade levels. GE’s are provided for Reading, Language, and Math.
The Grade Equivalent represents the grade level and month of the average performance for students. For example, an 8th grade student with a GE of 8.9 has earned a score similar to the average students’ scores who were in their ninth month of eighth grade.
In this example, the 8th grade student had a Language GE of 10.6. This means the student scored as well on eighth grade reading material as an average high school sophomore would have scored on the eighth grade reading material.
As a parent, if you see “10.6” you might think your child is ready for 10th grade. But, remember your child was not tested on 10th grade material; he was tested on 8th grade material. His above grade level score indicates that he did better than the average 8th grader in the sample group did. If this student was given a reading test designed for use at the 10th grade level, it is very unlikely that he would attain a GE of 10.6.
Therefore, the best way to interpret the GE score is to look at whether the student’s performance is average (a GE in grade level), above average (a GE above grade level), or below average (a GE below grade level).
Percentiles (NP/LP)
Percentiles compare your performance with other students within the same grade level. Your percentile rank indicates the percentage of students in the sample that had a lower score than you. Percentiles range from 1 (low) to 99 (high). A percentile rank of 50 is exactly average.
There are two types of percentile ranks: National (NP) and Local (LP). A national percentile compares your performance to students in a national sample. A local percentile compares your performance to local students. A local group consists of all of the students who tested at your school (if your testing was an independent effort) or in your school system/district (if your testing was part of coordinated, multi-school program).
In this example, Bo’s raw score on the Reading subtest is equal to the 63rd national percentile, which means his raw score was higher than 63 percent of the students in the national sample. His local percentile was a 69, which means his raw score was higher than 69 percent of the students in his group or school system/district.
Stanines (ST)
Stanine scores break percentile rankings into a 9-point scale, on which 9 represents the highest performance, 5 the average, and 1 the lowest.
There are two types of stanine scores: National (NS) and Local (LS). A national stanine compares your performance to students in a national sample. A local stanine compares your performance to local students. A local group consists of all of the students who tested at your school (if your testing was an independent effort) or in your school system/district (if your testing was part of coordinated, multi-school program).
Cognitive Skills Quotient
The Cognitive Skills Quotient is a measure of a student’s learning potential. The CSQ functions as a predictive index of a student’s future academic performance. The following guide may be used to interpret your CSQ:
above 130 represents academic potential found in approximately upper 3% of school population
110 & above represents academic potential found in upper 25% of school population
100–109 represents academic potential found in second quarter of school population (50th–75th percentiles)
90–99 represents academic potential found in third quarter of school population (25th–49th percentiles)
89 & below represents academic potential found in lower 25% of school population
below 70 represents academic potential found in approximately lower 3% of school population