For convenience, the CSQ was designed statistically to be interpreted in the same manner as the traditional IQ. Thus, the following guide may be used in evaluating the CSQ:
|
above 130
|
represents academic potential found in approximately | |
| the upper 3% of the school population | ||
|
110 & above
|
represents academic potential found in the upper 25% of the school population |
|
|
100–109
|
represents academic potential found in the second quarter of the school population—50th to 75th percentiles | |
|
90–99
|
represents academic potential found in the third quarter of the school population—25th to 49th percentiles | |
|
89 & below
|
represents academic potential found in the lower 25% of the school population | |
|
below 70
|
represents academic potential found in approximately the lower 3% of the school population | |
This score provides a comparison between student performance on an achievement subtest and that on cognitive skills subtests. A plus sign (+) indicates that the student’s achievement is significantly higher than would be expected while a minus sign (–) signifies that the achievement is significantly lower than would be expected. An equal sign (=) indicates that performance falls within the range of normal expectations.
Grade Equivalents (GE)
Percentile ranks compare the performance of an individual student with other students at the same grade level. Grade equivalents compare the performance of an individual student with the average performance of students at other grade levels. Consequently, the grade equivalent scale extends across grade levels. As a normative measure, the grade equivalent scores are subject to several limitations and certain precautions must be observed:
- Unfortunately, grade equivalents lend themselves to misinterpretation. Grade equivalents (GE) are meaningful only within the range of skills measured by the test administered. If a fifth-grade student earns a GE of 8.1 on the Math subtest focusing on fifth-grade content, this does not mean that he or she is capable of doing eighth-grade math. It simply means that the student can do fifth-grade math as well as an eighth grader can do fifth-grade math and is doing considerably better than most fifth graders. It must be remembered, however, that such a test was designed primarily to assess those math skills and concepts that should have been learned through the fifth grade. If this student were given a math test designed for use at the eighth-grade level, it is very unlikely that he or she would attain a GE of 8.1.
- Grade equivalents have little meaning in test areas with limited content similarity from grade to grade. For example, suppose that a school system teaches American History in Grade 6 and European History in Grade 7. If a test designed for Grade 6 were given to students in other grades, one can readily see what would happen. Students below Grade 6 would do poorly because they have not yet studied the content covered in the test. Students in Grade 7 would likely do more poorly than those in Grade 6 since they would likely have forgotten some of the material learned the preceding year. For example, it would not be unlikely for the sixth grade to attain an average of 50 while the seventh grade attained an average of 40. This would lead to such a contradiction as a score of 50 giving a grade equivalent of 6.5, while a lower score of 40 would give a higher grade equivalent of 7.5.
- Caution must be used when grade equivalents are used as the basis for placing students at grade levels that correspond to attained GE scores.
Grade Scores (GS)
This score may be defined as a normalized standard score which compares the perfomance of an individual student with other students at the same grade level. Since the grade score (GS) sets its average at grade placement, grade scores are very similar to grade equivalents of the student at the time of testing. Thus, if a midyear sixth grader (6.5) earned grade scores between 5.5 and 7.5, these grade scores may be used and interpreted in the same manner as grade equivalents.
Beyond this range, grade scores differ from conventional grade equivalents. Grade equivalents often “run wild” at the upper and lower end of the scale, and yield scores indicating that one eighth-grade student is reading at the second-grade level while another functions like a typical college sophomore. These extreme scores pose problems for most test users since they tend to be very unreliable statistically and can be confusing or even disruptive in student counseling and parent conferences.
To avoid these difficulties, STS uses a normalized SS, with the mean equal to grade placement and the standard deviation equal to 1.0, to give the compacted GS scale which allows for a maximum of +/–3.0 from grade placement. Thus, at Grade 8.5 the highest possible grade score would be 11.5, a deviation of +3.0 from grade placement, and the lowest possible would be 5.5, a deviation of –3.0 from grade placement. It should be noted that a grade score need not indicate grade placement. Therefore, if an eighth grader receives a GS of 5.5, it need not mean that the student reads or has math skills at the fifth-grade level. If the test focuses on eighth-grade skills, such a grade score would mean that the student scored very low on the national norm scale for eighth-grade skills.
It should be apparent that grade scores offer a convenient means of determing student growth from one year to another although they tend to be less precise for this purpose than standard scores. When interpreting grade scores, one must exercise the same care one applies to grade equivalents.
Normal Curve Equivalents (NCE)
Normal curve equivalents are a comparatively new normative measure developed as a uniform reporting method for Title I programs focusing on student improvement and growth. Although normal curve equivalents resemble percentile ranks in various ways, there are also fundamental differences which provide NCE’s with certain distinct advantages in this type of research setting. If your reports contain normal curve equivalents, STS will be pleased to provide you with special interpretation guides or other assistance as you may require in utilizing the data.
Percentile Ranks
The percentile-rank scale ranges from 1 to 99 and compares the performance of an individual student with other students at the same grade level. More specifically, a percentile rank signifies the percentage of raw scores in some normative group that is lower than the raw score attained by a given student. Thus, if an individual’s raw score on the Science subtest is equal to the 68th percentile, this means the raw score was higher than 68% of those in the normative group. If the normative group consists of a representative national sample, the percentile is termed “national.” If it consists of individuals in the student’s school or school system/district, the percentile is termed “local.”
|
|
Raw Score (RS)
This is simply the number of test items that were correctly answered by the student.
Standard Score (SS)
The standard score scale is properly termed an expanded standard score scale. It was developed in accordance with the principles and procedures of item response theory, specifically the Rasch Model, and is a single, equal-interval scale that extends across all grade levels for use with all tests. The scale ranges from approximately 100 at Kindergarten to approximately 800 at grade 12.
In essence, the standard score scale is a measure of performance independent of grade level, time of testing, or the test level that was administered. In practice, it becomes a basic index of growth when it is possible to compare the current standard scores with those obtained in one or more earlier testing programs. Such comparisons may be made for individual students, classes within a school, or schools within a school or district.
When making comparisons, one should not be concerned about the meaning or significance of the standard scores themselves. Instead, the focus of attention should be on the observed differences between the available standard scores.
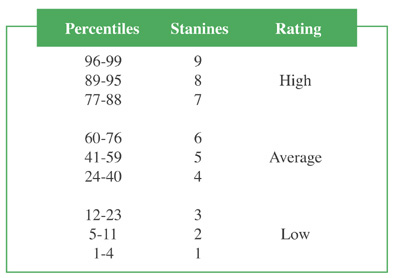
Stanines
This score provides a comparison between the student’s performance and that of other students in the same grade level. It utilizes a 9-point scale on which 9 represents the highest performance, 5 the average, and 1 the lowest. One advantage of stanine scores is their basic simplicity; the primary disadvantage is that they are a comparatively coarse measure and less precise, for example, than percentile ranks.
If one wishes to compare a student’s stanine scores on two different tests, a difference of only 1 stanine should be given limited significance. A difference of 2 stanines usually indicates a significant difference in performance on the two tests, but further evidence, such as a related course, should be examined as well. Stanine differences of 3 or more may be regarded as clearly indicating a significant difference in test performance.
Like percentile ranks, stanines may be either local or national in character, depending upon the normative group on which the scale is based (see Percentile Ranks).
Detailed percentile-to-stanine relationships are as follows: